


#8: US Inflation is dying, but not dead
Inflation should fall quickly over the course of this year, helping real incomes in the short term.

Summary:
Inflation is expected to fall precipitously in the year ahead
The terminal rate debate is now settled in the US
Potential for a short term rebound in growth thanks to rising real incomes
My next few posts will be shorter than usual as I look to make more frequent and concise observations about what’s going on.
The prevailing theme remains inflation proceeding lower as expected, influencing the market's perception of Fed policy. The most obvious example of lower inflation is that we’re now seeing outright deflation in goods which should continue in the near term.
Chart 1: Forget hyper-inflation, we’re now seeing outright deflation in core goods!

Source: VKMacro, FRED
But it’s not just goods prices which are providing comfort. We’re also seeing progress being in the ‘core services ex housing’ segment of PCE which is where the Fed’s focus lies.
There are some idiosyncratic factors keeping this segment elevated for now. One example is rising air fares. The crucial aspect is that disparities within the labour market appear to be diminishing.
Here are a few charts demonstrating this.
Chart 2: Small business hiring plans continue to fall at a rapid pace

Source: VKMacro, FRED
Chart 3: Firms within the services sector are no longer worrying about labour shortages
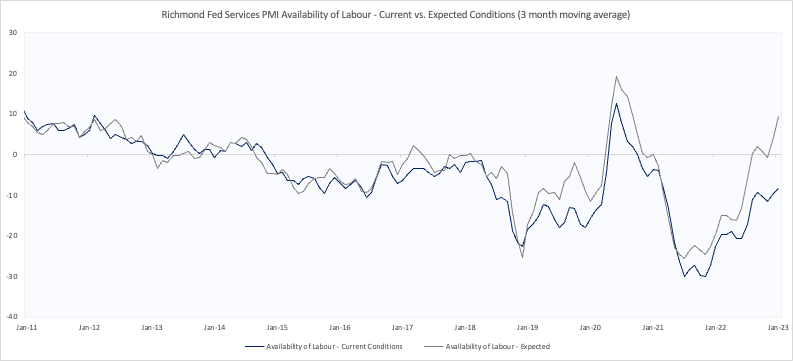
Source: VKMacro, FRED
Chart 4: Job cuts are increasingly being discussed relative to labour shortages at company calls

Source: Twitter, Bloomberg
Chart 2 shows that hiring plans are starting to moderate and return back to pre-pandemic levels.
Expectations of future hiring are also relatively tepid. Interestingly the Y/Y change in hiring plans are now consistent with recessionary conditions – I think this is something to watch. Remember, the key to identifying non-linear shifts in data, indicative of a recession, is monitoring the rate of change.
We’re also seeing firms within the services sector report labour supply has improved materially since the start of 2022.
There are a two interesting elements driving this. The first is the return to normal in areas where pandemic-driven over-hiring occurred. While tech layoffs have received all the headlines, the more interesting examples are employment within the warehousing sector, which fell for the second consecutive quarter at a rate of c. 1.8%. Another area where we can see pandemic related job losses is in furniture manufacturing which fell 1.5% in December relative to Q3 2022.
These factors – lower demand for labour and increased supply are also visible when analysing S&P 500 company call transcripts. Chart 4 via Bloomberg shows that the number of discussions around ‘labour shortages’ is reducing relative to ‘job cuts’ which corroborates the survey data presented.
Finally, reduced demand for goods and higher interest rates are beginning to impact some of the more cyclical areas of the labour market.
Chart 5: A reduction in temporary employees has resulted in the cyclical employment index turning negative over the last 3 months

Source: VKMacro, FRED
In December, cyclical industries reduced the number of employees relative to the previous three months, primarily due to layoffs of temporary workers and some cuts in the chemicals sector. Not yet evident is widespread weakness in other cyclical sectors, such as durable goods manufacturing and residential construction, currently sustained by high levels of backlogs.
The clear takeaway from the labour market is that the severe imbalance that we saw during the start of the year no longer exists thanks to a slowdown in hiring and increased availability of labour which is feeding into lower wage growth.
Remember, the level of unemployment isn’t as relevant for now, but rate of change in demand is.
So, what does this all mean for inflation?
The VKMacro Inflation Index is a composite indicator for the US with 9 sub-components covering input prices, supply chain bottlenecks and labour market conditions.
Chart 6: Leading indicators suggest inflation should continue to roll over in coming months

Source: VKMacro, FRED
Chart 7: Inflation indicators are no longer coming in at historic extreme levels

Source: VKMacro, FRED
The takeaway is that inflationary pressures are receding and inflation should continue to come down in coming months. The average percentile of 9 sub-components have also fallen from an average of 85-90% in mid 2022 to 60% as of December.
Does this mean every inflation print from now on will be lower than expected? Almost certainly not.
The purpose of this index is not to examine idiosyncrasies in inflation from a micro perspective, such as the effect of a change in CPI components weighting or higher wage growth during year-end. It aims to capture the general inflationary trend to determine cyclical turning points.
More important for investors is that the interest rates market has already internalised this.
Fed Fund futures show the market is increasingly pricing interest rate cuts towards the latter half of this year as lower inflation allows the Fed to become less restrictive and make their way towards neutral.
Chart 8: The market has increasingly priced in rate cuts for later this year despite the terminal rate edging higher

Source: VKMacro, CME
It also means we can finally say with more confidence now that the terminal rate debate in the US is now settled. The Fed is likely to hike to 5% or 5.25% and then pause until the economy finally cracks. The increased certainty within this area has helped to reduce rate vol – loosening financial conditions and leading to a weaker dollar.
Also consider the 3m2y curve in this context which has now inverted and is historically a very good indicator for signalling the end of a hiking cycle.
Chart 9: Rate hikes are historically inconsistent with an inverted 3m2y treasury curve

Source: VKMacro, FRED
Hard landing aside, the future scenario which I’m more focused on right now is one where growth accelerates in the short term due to rising real incomes in the US. In addition to this we also have the tailwind provided via China’s reopening.
Lower energy prices filter through to the consumer via lower gasoline and utility costs. In the same way that higher energy costs acted as a tax on consumer spending last year, the opposite should also be true now.
Chart 10: After an awful 2022, things are looking a bit better for real incomes in the US

Source: VKMacro, FRED
Rising real incomes can go a long way in helping consumer confidence rebound – we’re already seeing signs of this in both the Michigan and Conference Board survey.
It is also the only sustainable way to see a normalisation in the US savings rate from near record lows without seeing a material decline in spending. Sure, excess savings exist but the data here are unclear, usually lagging and aggregate in nature making it unhelpful to utilise as a forecasting tool.
But before delving too deep into such a scenario we need to see confirmation in the form of higher retail sales, or stronger real PCE growth in the coming months. We haven’t seen this yet.
One notable point is the market may have already begun to price this in. Consider the performance of the equal weight consumer discretionary sector both absolute and relative to the market.
Chart 11: Despite falling real PCE, consumer discretionary stocks continue to outperform the broader market

Source: Koyfin
I’ve been long since December and continue to hold as this view remain out of consensus for now. It’s possible that the market is reacting ahead of the hard data while being helped by lower rates (in the 10-year) and general oversold conditions. My gameplan here is to look for c. $140 or so as long as the trend remains positive before scaling back.
What would an out of consensus more benign growth outlook mean for the rates market?
If such a scenario were to materialise, it’s possible that the rates market could begin to price out any cuts expected later this year – currently at c. 50 bps. The rationale here is that the Fed may opt to look through lower inflation readings given how low unemployment is. Think of it as transitory disinflation.
This would provide a clear entry point to get back into treasuries which I have held off doing since I went long in July last year. Ultimately an environment where interest rates are at 5% in the US and rising rapidly towards 4% in the Euro Area is likely to cap the sustainability of any growth rebound and ultimately lead us into a recession, just later than the consensus expected.
So that’s the playbook I’m thinking about. Real PCE growth remains key to watch, as does the data coming out of China which the market will look to confirm existing expectations of a swift recovery.
Let’s see how it all develops; I think this year will be an interesting one in Macro!
Summary:
Inflation is expected to fall precipitously in the year ahead
The terminal rate debate is now settled in the US
Potential for a short term rebound in growth thanks to rising real incomes
Thanks,
VKMacro