


#3: The Consumer Has Never Been Unhappier

Summary:
Consumer confidence has collapsed globally
Historically low consumer confidence is consistent with weaker real consumption growth
Increases in the price of energy, durable goods, and housing is driving much of the pain
Expect consumer discretionary stocks to remain weak
Inflation is a bi*ch. No one enjoys having to spend an ever-increasing percentage of their salary on food and energy. Yet this is becoming a more frequent occurrence following the start of Russia’s war on Ukraine which led to a sharp spike in the price of energy and other commodities.
Is there any data to show just how unhappy people are?
Well, the main way investors typically get a gauge of how the consumer is feeling is via sentiment surveys.
The University Michigan Consumer Sentiment Index (UMCSI) recently caught headlines as it recorded the lowest reading going back to 1978. This data point goes directly against the ‘strong consumer’ narrative that many in the market have continued to peddle this year.
So why do consumer confidence surveys matter?
Historically, high and rising consumer confidence has been consistent with strong real demand. This relationship has a long history going back to the late 1970’s.
Chart 1: The University of Michigan Consumer Sentiment Survey has collapsed

Source: FRED, VKMacro
Clearly the two are never going to tie up one for one, and the relationship became particularly undone around the pandemic. However, the takeaway is clear. Weak and falling consumer confidence should lead to weaker real demand.
The picture gets a bit more complex however as the UMCSI isn’t the only consumer survey out there. Conference Board, another reputable institution provide their own consumer confidence survey where the picture is a bit more positive.
Chart 2: The Michigan survey is telling a very different story about consumer sentiment relative to Conference Board

Source: Koyfin, VKMacro
So why is there such a difference?
The main reason is because of survey composition and focus areas. The table below shows the underlying criteria which makeup each survey.
The takeaway is that the Michigan survey is a bit more focused on buying conditions, while Conference Board focuses on the labour market. This is important given the dynamic we’re currently experiencing of rapidly rising prices.
The difference between the surveys is telling us that despite a relatively robust labour market, consumers are increasingly signalling they are feeling less confident about making big purchases going forward.
Chart 2 shows that UMCSI typically leads the Conference Board survey to the downside. This makes sense when thinking about the causality as lower real consumption should over time reduce demand for labour.
The other reason is due to the political bias that exists within the Michigan survey in particular. The University produced research showing that consumer sentiment spiked at the end of 2016 when President Trump took office as economic conditions remained unchanged. The opposite then occurred as President Biden took office in late 2020 as the UMCSI survey fell amid a rapidly improving economy.
However, the University’s report does suggest that despite the one-off shifts in sentiment that occurred, correlations among both groups among the various questions asked remained high.
Pitfalls of survey construction aside, there are a number interesting takeaways contained within the report.
Sentiment by Age and Income bracket
Chart 3: Higher income households are reporting less confidence than those on middle and lower incomes

Source: University of Michigan, VKMacro
Chart 4: 18-34 year olds continue to report higher confidence about their situation relative to older respondents

Source: University of Michigan, VKMacro
Given the impact high inflation has on the spending power of lower income households, my bias would have been to assume that they would exhibit the lowest confidence. However, this isn’t currently the case. While doesn’t provide any further information, we can make a few educated guesses.
Those on higher incomes are more sensitive to declining stock prices
Older people are more likely to be worried about inflation given the closer proximity to the 70’s relative to younger people
Older people are more likely to suffer due to no longer being able to draw on their home equity (HELOC) due to higher mortgage rates
Older people/ those on higher incomes are more likely to self-identify as Republican
Nominal incomes are currently rising faster for lower income workers than those on higher incomes
It’s likely that a combination of these factors has resulted in this discrepancy, but we can’t know for sure. Given the signs that the labour market could be weakening, it remains worth watching how this dynamic evolves.
Sentiment about personal situations
Chart 5: People are feeling less and less confident about their current situation

Source: University of Michigan, VKMacro
Chart 6: Drivers of lower personal sentiment readings

Source: University of Michigan, VKMacro
Consumers have increasingly become more pessimistic about both their existing personal situation and how they expect it to evolve over the next 12 months. The main reason provided for this is ‘high prices’. This is a common theme across the survey.
Sentiment about job security
Chart 7: Despite low sentiment, consumers have never felt more secure in their jobs

Source: University of Michigan, VKMacro
The notable point here is that a slowing economy hasn’t yet translated into consumers believing their job is at risk. This sentiment is also consistent with what companies are saying in recent earnings reports which show labour shortages remain widespread.
Sentiment about making large purchases of household goods, vehicles and housing
Chart 8: Buying conditions for large household goods have cratered

Source: University of Michigan, VKMacro
Chart 9: Rapidly higher prices make purchases of large household goods unlikely

Source: University of Michigan, VKMacro
Price pressures are so prevalent, that consumers are now saying it is among the worst times on record to make large purchases of household goods. This is not what we’ve historically seen as usually it’s the combination of ‘general uncertainty’ and ‘lack of affordability’ that has driven this index down. Today, ‘lack of affordability’ as a reason remains near its historic lows.
Chart 10: Consumers are saying this is the worst buying condition for vehicles

Source: University of Michigan, VKMacro
Chart 11: Supply chain issues have resulted in a sharp rise in the price of vehicles

Source: University of Michigan, VKMacro
With vehicles the situation is also a bit different today than the last cycle. During the 2002-2007 cycle, higher gas prices were the primary driver preventing purchases of vehicles. Today, the main concern is about higher prices of autos themselves as supply chain disruptions have resulted in the price of even used cars remaining elevated.
Chart 12: The housing market is increasingly unhealthy

Source: University of Michigan, VKMacro
Chart 13: The combination of high house prices and rising interest rates have made consumers less likely to buy a house

Source: University of Michigan, VKMacro
Despite higher interest and mortgage rates, it is housing affordability that is seen as the main driver in dampening consumer sentiment.
So, the takeaway is clear. It is high prices, not a weaker economy right now that is driving down consumer sentiment. If lower sentiment were to result in reduced spending which has historically been the case, we should also expect the broader economy to weaken as well.
Low consumer confidence isn’t isolated to the US however. Various consumer surveys across the globe also shows a similar picture. Below are a number of charts showing consumer confidence for a range of other countries.
United Kingdom GfK Consumer Confidence
Chart 14: The ‘cost of living crisis’ has resulted in a rapid deterioration of consumer sentiment

Source: Koyfin, VKMacro
UK consumer confidence is now at record lows. Given the years of negative real income growth, and the sharp increase in energy bills (which I talked about in my first post), the situation has become increasingly difficult.
GfK report that:
Consumer confidence remains severely depressed this month as the impact of soaring food and fuel prices and rising interest rates continues to darken the financial mood of the nation.
Germany GfK Consumer Confidence
Chart 15: Consumers are worried about the risks of energy rationing

Source: Koyfin, VKMacro
GfK state that:
In addition to concerns about disrupted supply chains, the war in Ukraine and soaring energy and food prices, there are now worries about sufficient gas supplies for businesses and households next winter. This is currently causing consumer sentiment to hit rock bottom,
Fears of an impending recession are rising among consumers. Economic expectations dropped 6.5 points in July compared to the previous month and have sunk to -18.2 points. This is the lowest value since April 2020, when Germany went into lockdown due to the pandemic.
The significantly higher burden of sharply rising energy and food prices on private households is increasingly affecting the propensity to buy. If far more must be spent on oil and gas, correspondingly fewer financial resources remain for other purchases.
Italy Istat Consumer Confidence
Chart 16: Political crises coupled with a weaker economy has hit Italian confidence

Source: Koyfin, VKMacro
While the picture in Italy isn’t quite as bad as the UK or Germany, it is deteriorating rapidly.
France Insee Consumer Confidence
Chart 17: French consumer confidence has also cratered
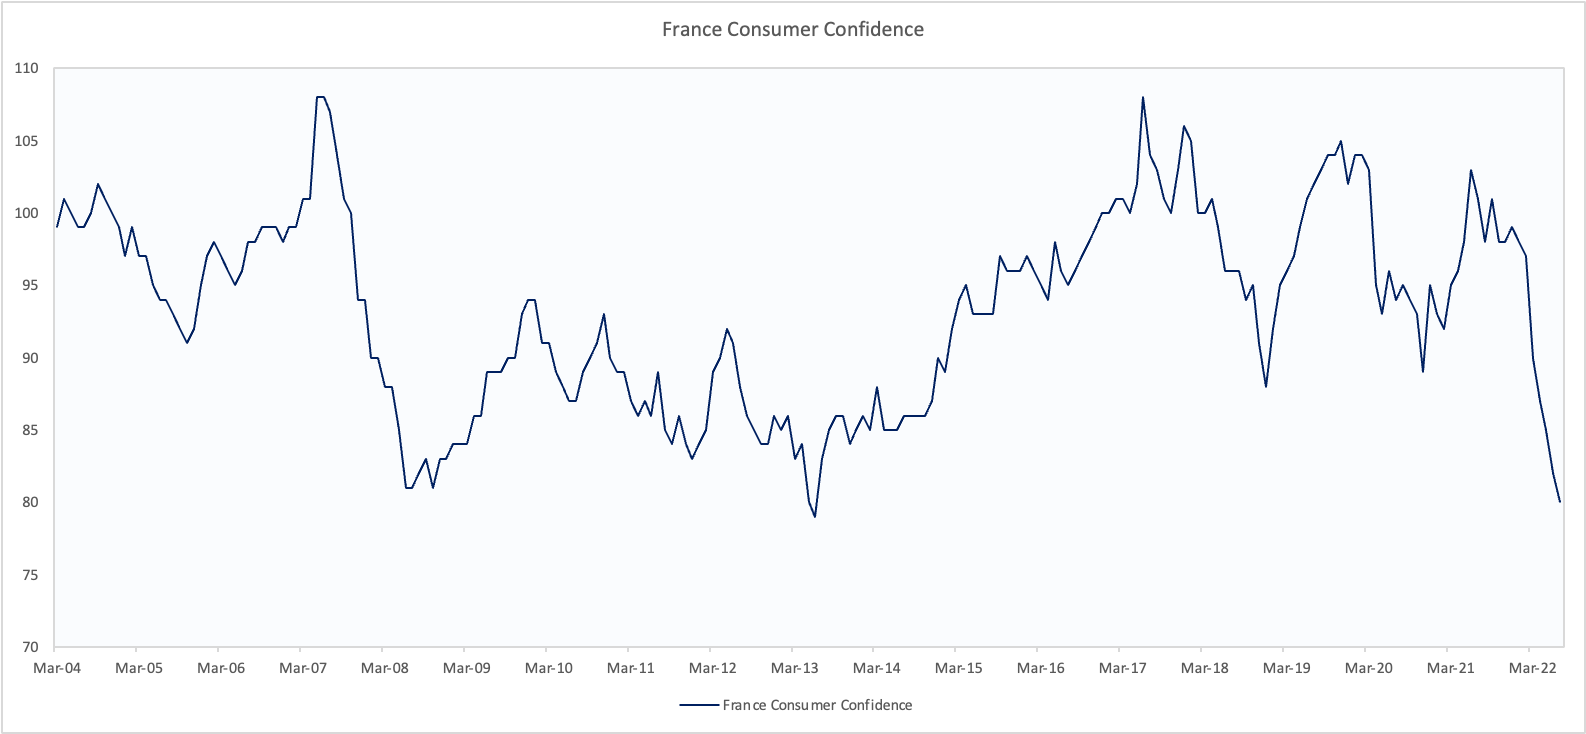
Source: Koyfin, VKMacro
French consumer confidence is now at the second lowest reading going back to 1972.
Japan Consumer Confidence
Chart 18: The post covid bounce-back in Japanese consumer confidence is over

Source: Koyfin, VKMacro
The Japan Consumer Confidence index mirrors the findings from the US. The survey is made up of four different components. ‘Overall livelihood’, ‘income growth’, ‘employment prospects’, and ‘willingness to buy durable goods’.
Interestingly, the ‘employment prospects’ component remains elevated and close to its post covid highs, while the ‘willingness to buy durable goods’ component is at all-time lows.
Chinese Consumer Confidence
Chart 19: Zero-covid has stifled out the Chinese consumer

Source: Koyfin, VKMacro
Chinese consumer confidence has collapsed since March as a result of the on-going ‘zero covid’ policies. This is one of the reasons Chinese youth unemployment has risen to 19.3% from c. 12% at the start of 2020.
The constant fear of lockdowns makes it harder for the country’s private sector to create the jobs required to employ the 11 million or so graduates which enter the workforce each year. The Grid reports due to China’s ‘common prosperity’ initiative is also having a negative impact as many private internet firms are now firing more than they’re hiring.
Bloomberg also reported that the word ‘layoff’ has been trending on Baidu’s search engine.
Given the trend we’re seeing of declining consumer confidence, it seems more and more likely that consumer spending will struggle over the second half of this year. The fact that we’re seeing the same signal across multiple geographies and surveys increases this probability. It’s very likely that consumer discretionary names remain underweights, especially after the sharp bounce back we’ve seen in recent months.
Summary:
Consumer confidence has collapsed globally
Historically low consumer confidence is consistent with weaker real consumption growth
Increases in the price of energy, durable goods, and housing is driving much of the pain
Expect consumer discretionary stocks to remain weak
Thanks
VKMacro