

#2: The perfect S.T.O.R.M for bonds is now abating
#2: The perfect S.T.O.R.M for bonds is now abating
Why I think long duration is attractive here.

Summary
I believe there’s a strong probability of a sharp rally in Treasuries over the next 12 months. This is driven by four key factors:
A rapidly weakening global and US economy
Falling inflation driven by lower commodity prices, and surplus of goods
A Fed pivot from their current hiking path
A lower Copper/Gold ratio
I tend to make higher returns in bear markets than bull markets.
The way I did it was to ignore equities, pretty much take them of the table and buy bonds, buy treasuries, and go home. Well, I’ve never been presented a cocktail where you have 8% inflation, you think the economy might weaken, and bond yields are at 3%. It’s an analogue with no precedent in history
So, for the golfers out there, I feel like I’m going to play a round of golf without a driver and without a 60-degree wedge because bonds which have been my go-to asset for a recessionary/ bear market atmosphere, they may work but there’s reason to believe things may be different this time.
Stanley Druckenmiller, Sohn Conference, June 2022.
While Druck is worried about playing without his driver, I am getting bullish on treasuries here. Before I go on to explain why, it’s worth mentioning that this is probably one of the scarier trade ideas I’ve had during my short time in markets.
It’s easy to see why. Inflation is now at multi-decade highs, and has been accelerating on a trending 3m/3m basis.
We’ve also had a chorus of investors demanding that the Federal Reserve should hike rates at a more aggressive pace, and have discussed the possibility of inflation staying elevated in the face of a weaker global economy.
Bill Ackman is probably the most vocal of these. He’s written a couple of tweet threads which are worth your time to read, the first one on the price action in longer term rates at the start of July, another was after the latest CPI print on 14 July, but the best resource is his latest presentation at the New York Fed’s Investor Advisory Committee (IAC). It’s well known that Ackman is likely talking his book given to the interest rate hedge which has helped protect his portfolio this year, but his points are well reasoned and worth considering.
I differ with his view on a few areas.
The first point of difference is on time horizon. I’m not here to tell you where rates will be in 3 years’ time, my view is only about the next 12 months.
The second is a difference in process. When reading through the IAC pack, it seems that Ackman was mostly focussed on backward looking data and views them in an absolutist manner. The key thing I’ve learned during my time in macro is that we need to be anticipatory rather than focusing on lagging data such as CPI, and that it’s the delta that matters most to markets, rather than absolute levels.
Apart from those two areas, I don’t disagree with a lot of what he says. The labour market is clearly tight, and demand within the economy as of the second quarter remained fairly robust, although we are clearly seeing some slowing.
So why do I think now is the time to start getting long duration? Well, let’s just say the perfect storm hitting bonds is abating. What is S.T.O.R.M you may ask? I see it as:
Strong Demand
Tight labour markets
Overwhelmed Supply Chains
Rocketing energy prices
Materially higher interest rates
I will try and tackle each of these points while using what I see as the fundamental drivers of longer-term bond yields as my guide.
The economy is clearly slowing.
I look at things from a cyclical framework, so while I do care about whether we are growing or contracting, the rate of change is more important.
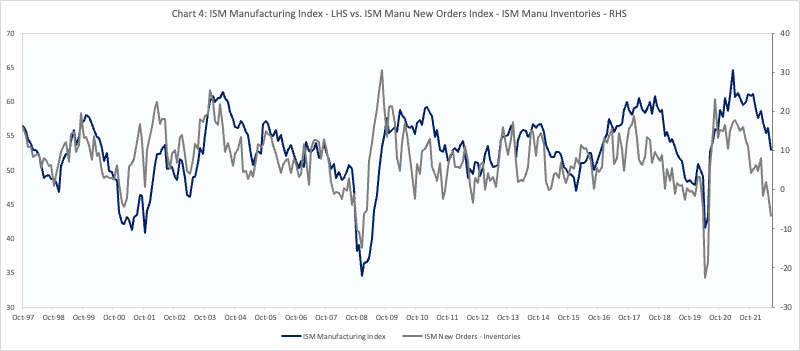
Since the start of 2022, it has become evident that growth is slowing across the economy, following a strong 2021. The two main areas where this weakness is currently evident is within the manufacturing and housing sector.

Source: Koyfin, VKMacro
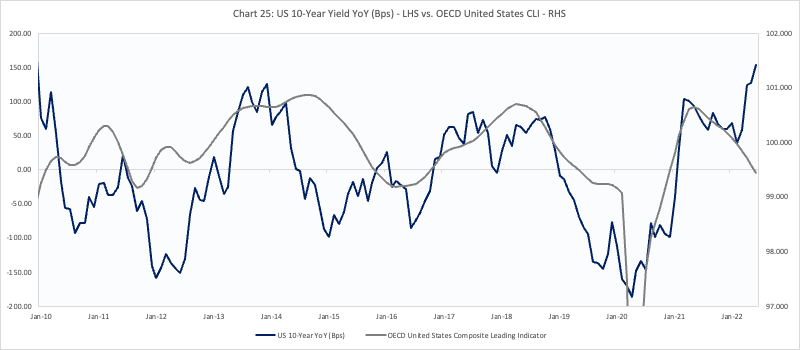
Typically slowing growth as shown by the ISM manufacturing survey declining (ISM is being used a proxy for economic growth), should lead to lower bond yields on a YoY basis.
This makes sense from a number of perspectives, whether it is because bonds become more attractive relative to equities or because investors expect a higher probability of rate cuts. The important thing to note is that more recently, longer dated yields have risen in the face of a slowing economy.
Equities already seem to have got the message, as cyclicals have underperformed relative to defensives over the last 6-8 months.

Source: Koyfin, VKMacro
I think it has been interesting that long bonds have failed to catch a bid despite falling equities and deteriorating market internals.
Further, there are reasons to believe the US slowdown should continue as real wages continue to fall due to painfully higher food and energy costs. Indeed, it’s not just the US that faces this issue, the situation is worse in much of Europe and rest of the world, which also hurts the exports of multinationals. China remains a notable worry as the economy is struggling to get out of first gear due to their zero-covid policies and a hamstrung property market.

Source: FRED, VKMacro
Source: Bloomberg, VKMacro
Leading indicators provide a reasonable probability that the ISM Manufacturing index should continue heading lower over the next few months. The charts above show that it is possible that we see the headline ISM Manufacturing index fall below 50, signalling contraction.
Continued negative survey data should increase the attractiveness of Treasuries.
Expectations of future interest rates
Another theory is that longer rates are driven by the expectations of future short rates. For instance, investing in a two-year bond is a lot like investing in two one-year bonds back-to-back: one now and another one a year later.
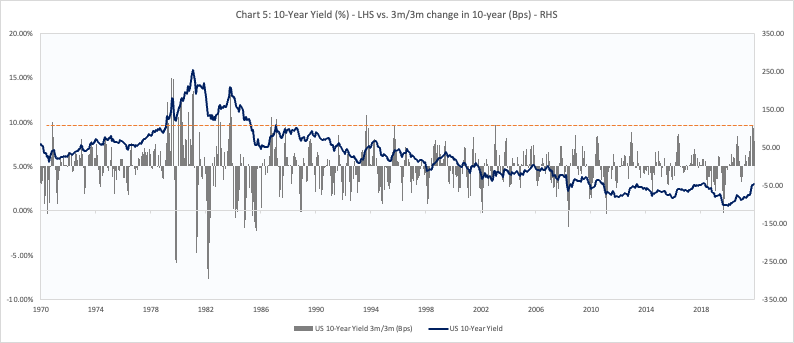
Soaring inflation which rose above 6% began forcing the Fed’s hand late last year. Inflationary pressures were then exacerbated by the onset of Russia’s war on Ukraine.
Rates shifted up rapidly in response to the Fed accelerating their hiking path, causing uncertainty about where neutral rates lie in a more inflationary world.

Source: Koyfin, VKMacro
Note, while the rapid increase in rates occurred across the curve, the c. 110bps increase we saw in the 10-year over a rolling 3-month period sits in the 90% percentile of readings going back to 1970.
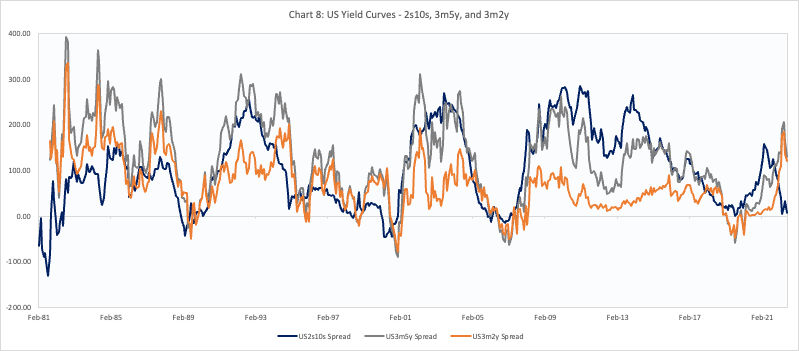
Another way to look at the rapid shift in interest rate expectations is by observing the shape of the yield curve. The 3m2y yield curve bear steepened initially as interest rate expectations rose. The more interesting point however, is the even faster flattening that has taken place more recently.
The flattening we are now seeing is the market telling us they no longer believe the Fed’s forward guidance. You can also see this via Fed Fund futures, which are now pricing in rate cuts over 2023.

Source: Koyfin, VKMacro
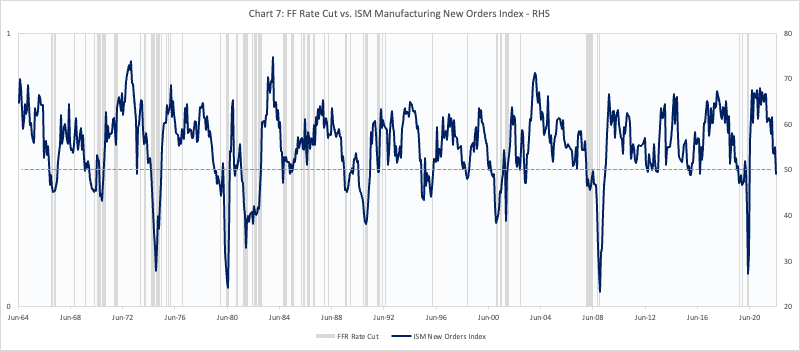
Doubting the Fed here has historic precedent.
The chart below shows each time the Fed has cut rates by 25bps or more against the ISM New Orders Index. As expected, interest rate cuts are centred around times when ISM New Orders are either in free-fall and close to 50 (sharp deceleration but still growing), or when they are in outright contractionary territory.
Source: Bloomberg, VKMacro
Given the Fed’s desire to break the back of inflation in the near term, it’s likely that they continue to hike despite initial growth concerns. While hiking initially caused the long-end to sell-off, we should not expect to see this going forward. In fact, greater than expected hikes from now on, are likely to be more bullish for the long end.
Source: Koyfin, VKMacro
Another factor that could put pressure on the Fed is the employment outlook. It’s clear from Fed speeches that the tightness of the labour market has been a source of concern; the high number of job openings relative to unemployed persons being a good example here.
While the Fed have discussed the possibility of achieving a soft landing by reducing job openings, this seems increasingly seems wishful given the latest ISM employment, and Initial Claims data show job losses are starting to rise.

Source: Bloomberg, VKMacro
Note, the ISM surveys, which are now below 50, show a narrow picture relative to the S&P Global surveys which still show the employment is expanding (especially within the Services sector) but at a slower pace. Whichever way you look at it, the labour market is likely to deteriorate given slowing demand over the coming quarters. This will matter to the Fed.
Rapidly rising inflation
In theory, if you expect longer term inflation to be high, you should demand a higher level of interest relative to investing in shorter rates.
High inflation has resulted in the Fed’s reaction function deprioritising their full employment mandate in favour of getting inflation down. It has resulted in them ditching the poorly thought out Flexible Average Inflation Targeting (FAIT) framework, which caused them to react slower to inflation rising following the pandemic.
We’ve also had a number of market commentators continually predict “peak-inflation” for months now, and it just hasn’t happened. Unfortunately I include myself in this.
The issue is there were few reasons to believe inflation would come down so soon, given the rapid rise in commodity prices, stifled supply chains and ever-rising inflation indicators. For instance, observe the chart below which shows the ISM Manufacturing Prices index vs. the 3m/3m change in headline CPI. We’ve actually seen the 3m/3m rate of change in CPI increase over the last few months due to higher food and energy prices.

Source: Bloomberg, VKMacro
Until recently, the ISM Input Price index remained stubbornly high. However, in the last few months, we’ve seen three lower prints, as well as declines in commodity prices across the board.
The Commodity bit is important here, as there’s been no respite for businesses that use raw materials as inputs, and for consumers who use gasoline to fill their cars.

The chart above shows the YoY change in yields against the YoY change in commodity prices. We can see that until very recently, the increase in commodities has been steep, and this has also been one of the factors keeping bond yields elevated.
This has been an evolving story over the last couple of months. We’re seeing a smaller number of commodities at or close to their recent highs. Copper, Oil, Gasoline, Steel, Aluminium, Soybeans, Wheat, Corn, and Lumber are all experiencing significant drawdowns. Natural Gas now remains a lone wolf in the commodity space. In my view, this increases the probability that the weakness we are seeing is due to the macro picture, rather than being idiosyncratic.
Taking a step back, this is exactly what we should expect. Higher prices, especially when commodity driven should eventually lead to lower demand.
Source: Bloomberg, VKMacro
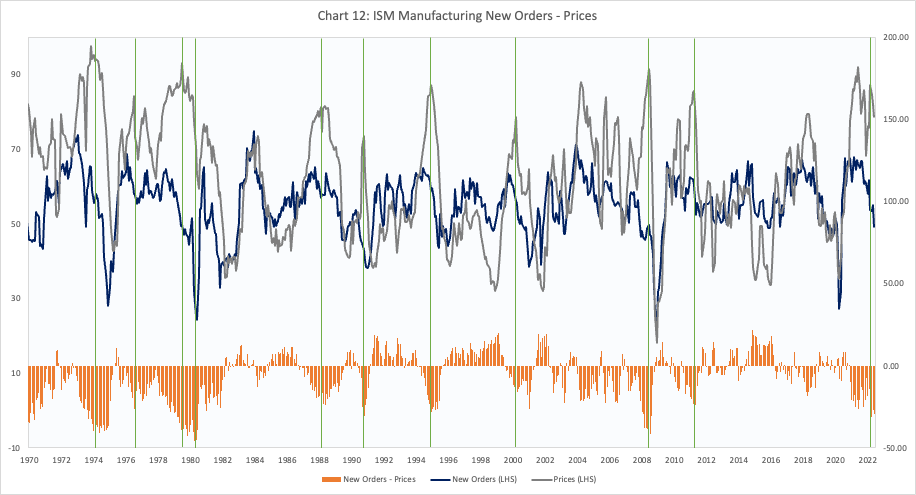
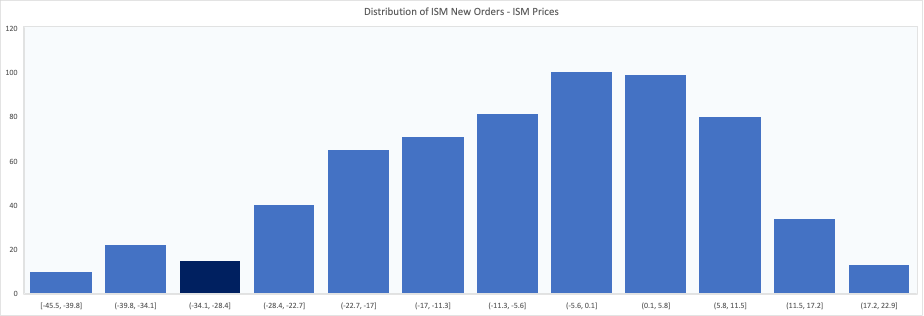
The chart above shows the ISM Manufacturing New Orders index, and the ISM Manufacturing Prices index, as well as the historic spread between the two. The important takeaway here is that whenever the spread between demand (new orders) and prices has peaked, so do price pressures.
The current spread of c. -33, is in the bottom 5th percentile of readings going back to the 1970s, and there is reason to believe it has just peaked given the demand picture.
Naturally the peak between demand and prices also corresponds with the top in Oil on a YoY basis, and it also corresponds with where the Fed has historically begun cutting rates.
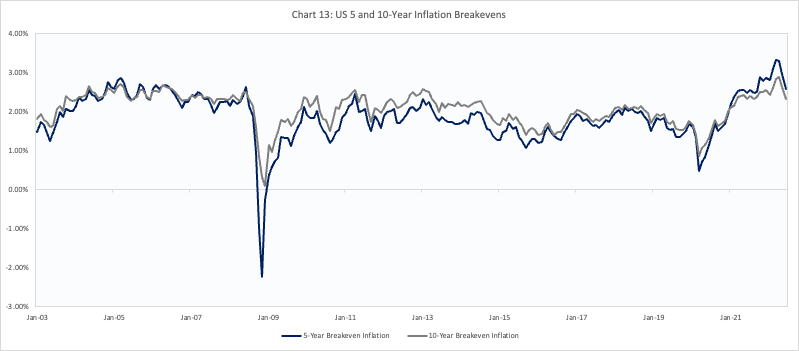
I believe this is a key driver behind the decline in market-based inflation expectations that we’ve observed over the last few months.
Source: FRED, VKMacro
Falling inflation expectations without a corresponding fall in bond yields tells us the market is telling us that financial conditions are tightening, and that Fed policy is incrementally more hawkish given the state of the economy.

Source: FRED, VKMacro
One pushback I am likely to receive is that it looks like China could behind the worst of their lockdowns, as shown by the rebound in PMIs. This could boost commodity and goods demand as the economy recovers, something which hasn’t been there in recent months.
While these arguments are fair, it’s worth noting that the Chinese recovery has been lacklustre. In addition, Chinese demand typically doesn’t impact the US economy until about 6 months later. For instance, the chart below shows the OECD Composite Leading Index for China tends to lead US inflation by at least 6 months.

Source: FRED, VKMacro
Another pushback should be that supply chains remain at risk, which has helped increase goods inflation over the last couple of years. I’ve been too positive on supply chain normalisation but due to the never-ending waves of Covid globally, this just hasn’t been the case.
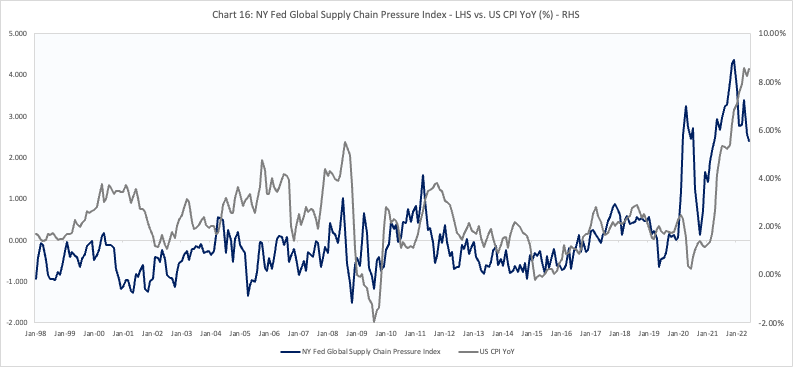
The chart below shows the New York Fed’s Global Supply Chain Pressure Index (GSCPI) against CPI YoY (%). The NY Fed’s GSCPI is comprised of various measures such as delivery time PMIs, the Baltic Dry Index, airfreight costs, and the Harpex Index to give a comprehensive measure of stress on global supply chains.
Source: FRED, VKMacro
We should acknowledge the real constraints businesses have been under, and the difficulties they’ve had in getting the inputs they need to operate. The chart shows the GSCPI has now fallen from all-time highs at the end of December 2021 and have most recently benefitted from the re-opening in China which have helped to ease pressures materially.
While there’s no certainty that Covid related supply issues won’t persist, we should expect demand related pressures to ease as consumer preferences shift from goods to services (see Real PCE for Goods in the US vs. Real PCE for Services).
A consequence of this could be inventory builds, as businesses are unable to react to the speed at which demand is shifting at a time when supply normalises. This would be a re-telling of a tale as old as time - supply shortages followed by supply gluts. The classic ‘Bullwhip effect’ from switching the economy off and on again.
We are already starting to see signs of this in the US retail sector. The chart below shows Inventories/ Sales for various retail components ex autos (where pressures persist).

Source: FRED, VKMacro
Using a rolling five-year Z score of inventories to sales, we can see inventories are now on the rise which is a classic late-cycle signal.
Other factors
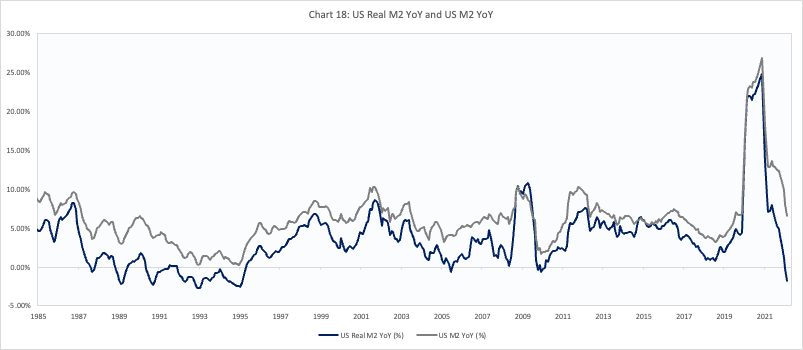
Another factor inflation bears will point to is the rapid increase in broad money we’ve seen since the pandemic. However, it was clear from the outset that this was linked to government support measures and would only be a temporary spike. In fact, real M2 growth on a YoY basis is now negative, but more importantly, it’s clear that the relationship between inflation and the growth in broad money is negligible.
Source: FRED, VKMacro
Mean-reversion is also on the side of those who are long bonds. Given the rate at which yields have increased, the distance from the 12-month moving average is now elevated.

Source: Koyfin, VKMacro
Typically, when the distance between the current yield and the historic 12 month moving average peaks, this usually coincides with a short-term top in bonds yields. Even if you don’t buy the fundamental argument here, there’s a case to be made that good old mean-reversion is likely to occur here.
We can also use market prices of other assets to determine where the 10-year should trade given historic relationships. The Copper/ Gold ratio, for example, and has rolled over the last few months.

Source: Koyfin, VKMacro
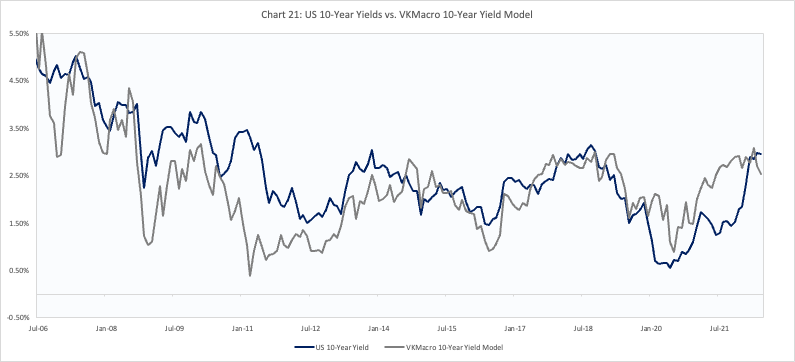
I’ve taken this further to use a broad basket of market assets in order to increase the correlation against yields and reduce the impact of idiosyncrasies. Chart 21 shows the VKMacro 10-year yield model has also peaked which signals a lower 10-year yield.
Source: Koyfin, VKMacro
A final point is that the sharp increase in bond yields over the last nine months, from a low base, has resulted in large losses due to the duration effect. This in turn has reduced the weight of fixed-income assets in pension fund portfolios. The FT recently reported that the decrease in the value of government bonds which are used as collateral for liability driven pension portfolios require them to re-stock on these assets to ensure they have sufficient collateral to maintain portfolio hedges. This dynamic also applies in the US, which means there are large buyers of fixed income over the coming six months or so, further adding to the investment case.
Where could I be wrong?
There are plenty of things that could go wrong, including further supply chain issues, an escalation of the energy crisis and more.
The nightmare scenario is that we see a situation similar to the 1970s. One could summarise the 70’s inflation in 3 ways.
A supply driven shock to energy and food prices.
A rapidly growing labour force increasing demand per capita; and
Labour market power driven by strong unions.
The impact this had was to de-couple the relationship between growth and inflation, which in turn changed how yields behaved.
Source: FRED, VKMacro

Source: FRED, VKMacro
The reason for using the ISM index here rather than CPI is because it is more sensitive to changes in price pressure versus CPI which tends to lag.
The de-synchronous relationship between growth and inflation resulted in a very different correlation between bond yields and growth.

Source: FRED, VKMacro
Source: FRED, VKMacro
Chart 24 shows there was little to no correlation between the change in bond yields and prices during the 1970s.
More recently however, the change in yields have moved in line with changes in economic growth. Given the demographic differences, and the pandemic driven supply issues, I remain in the camp that this scenario is unlikely to occur, even if inflation is a bit more volatile going forward.
Conclusion
I believe there’s a strong probability of a sharp rally in Treasuries over the next 12 months. This is driven by four key factors:
A rapidly weakening global and US economy
Falling inflation driven by lower commodity prices, and surplus of goods
A Fed pivot from their current hiking path
A lower Copper/Gold ratio
At the time of writing this post, I am long $IGLT (UK Gilts) and $IBTL (US 20 Year + Treasuries) and will look to add to these positions over time. I am targeting roughly 2.4% on the 30-year Treasuries
They say the scariest trades tend to end up being the most profitable, and I’m hoping we’re not just in the eye of the storm with this one!
Thanks,
VKMacro
Great post! I have a similar view as you and have started buying some long bonds the last couple of weeks. One question, What goes in to your VKMacro 10-year yield model?